Fan Chart
Bespoke Fan Charts
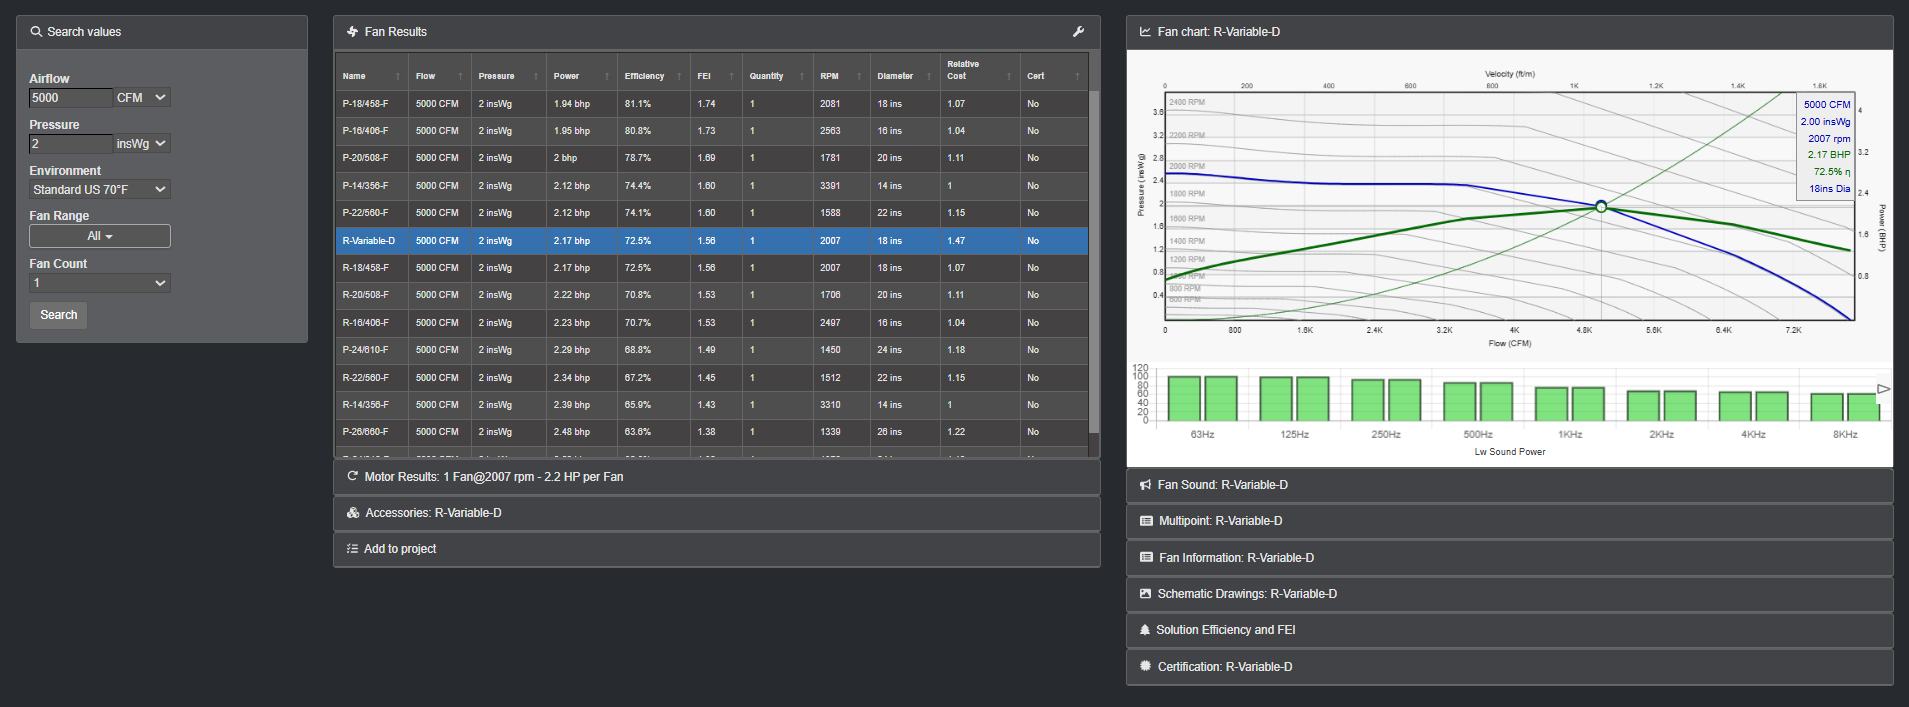
Our fan selection software is designed with complete customisability in mind with everything on the software being bespoke to our clients including how fan charts are presented.
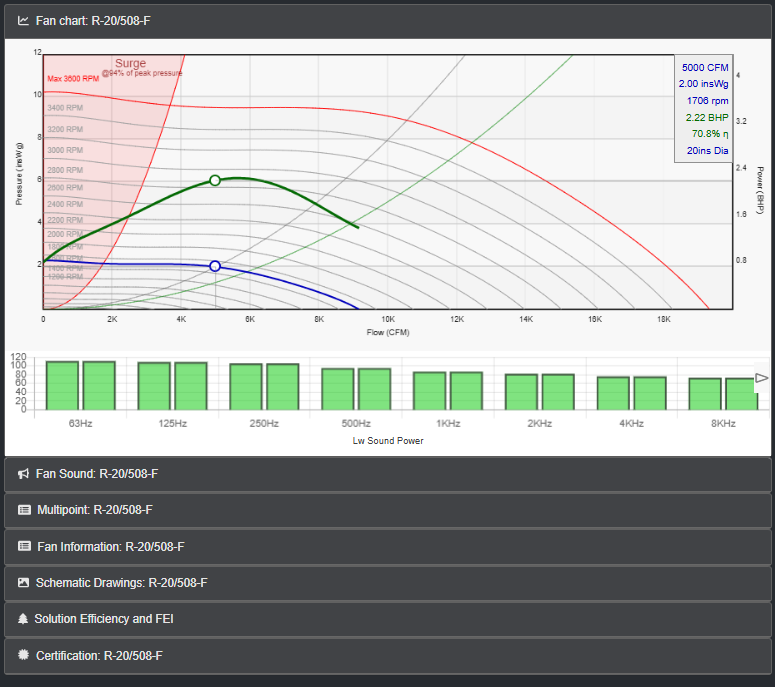
We understand that each client has different needs; some may prefer a clean, simplified fan chart showing only the performance curve, while others may require additional data such as showing the max RPM curve, FEI bubbles or the surge stall curve.
Whatever your requirements, we’re committed to tailoring the software and its outputs to suit your specific needs.
Our USP lies in our ability to deliver a truly bespoke solution, ensuring the fan selection process works exactly how you need it to.
Max RPM curve
The max RPM curve represents the threshold at which the fan reaches its highest allowable rotational speed without compromising safety or performance.
It appears on the fan chart as a boundary line, beyond which the fan should not be operated.
This curve is essential for identifying the limits of the fan’s mechanical and structural integrity under different airflow and pressure conditions.
Operating beyond this curve can lead to excessive vibration, increased wear, or even catastrophic failure. Including the max RPM curve on a fan chart allows users to make informed decisions when selecting fans for demanding applications, ensuring the system remains within safe operational parameters.